Sales Summary - Interactions Tab
The Interactions tab is used to view the number of vehicles sold based on the type of interaction that generated the sale, such as service appointments or sales campaigns.

|
To access the Interactions tab, select the Interactions tab on the Report Results panel on the Sales Summary screen. |
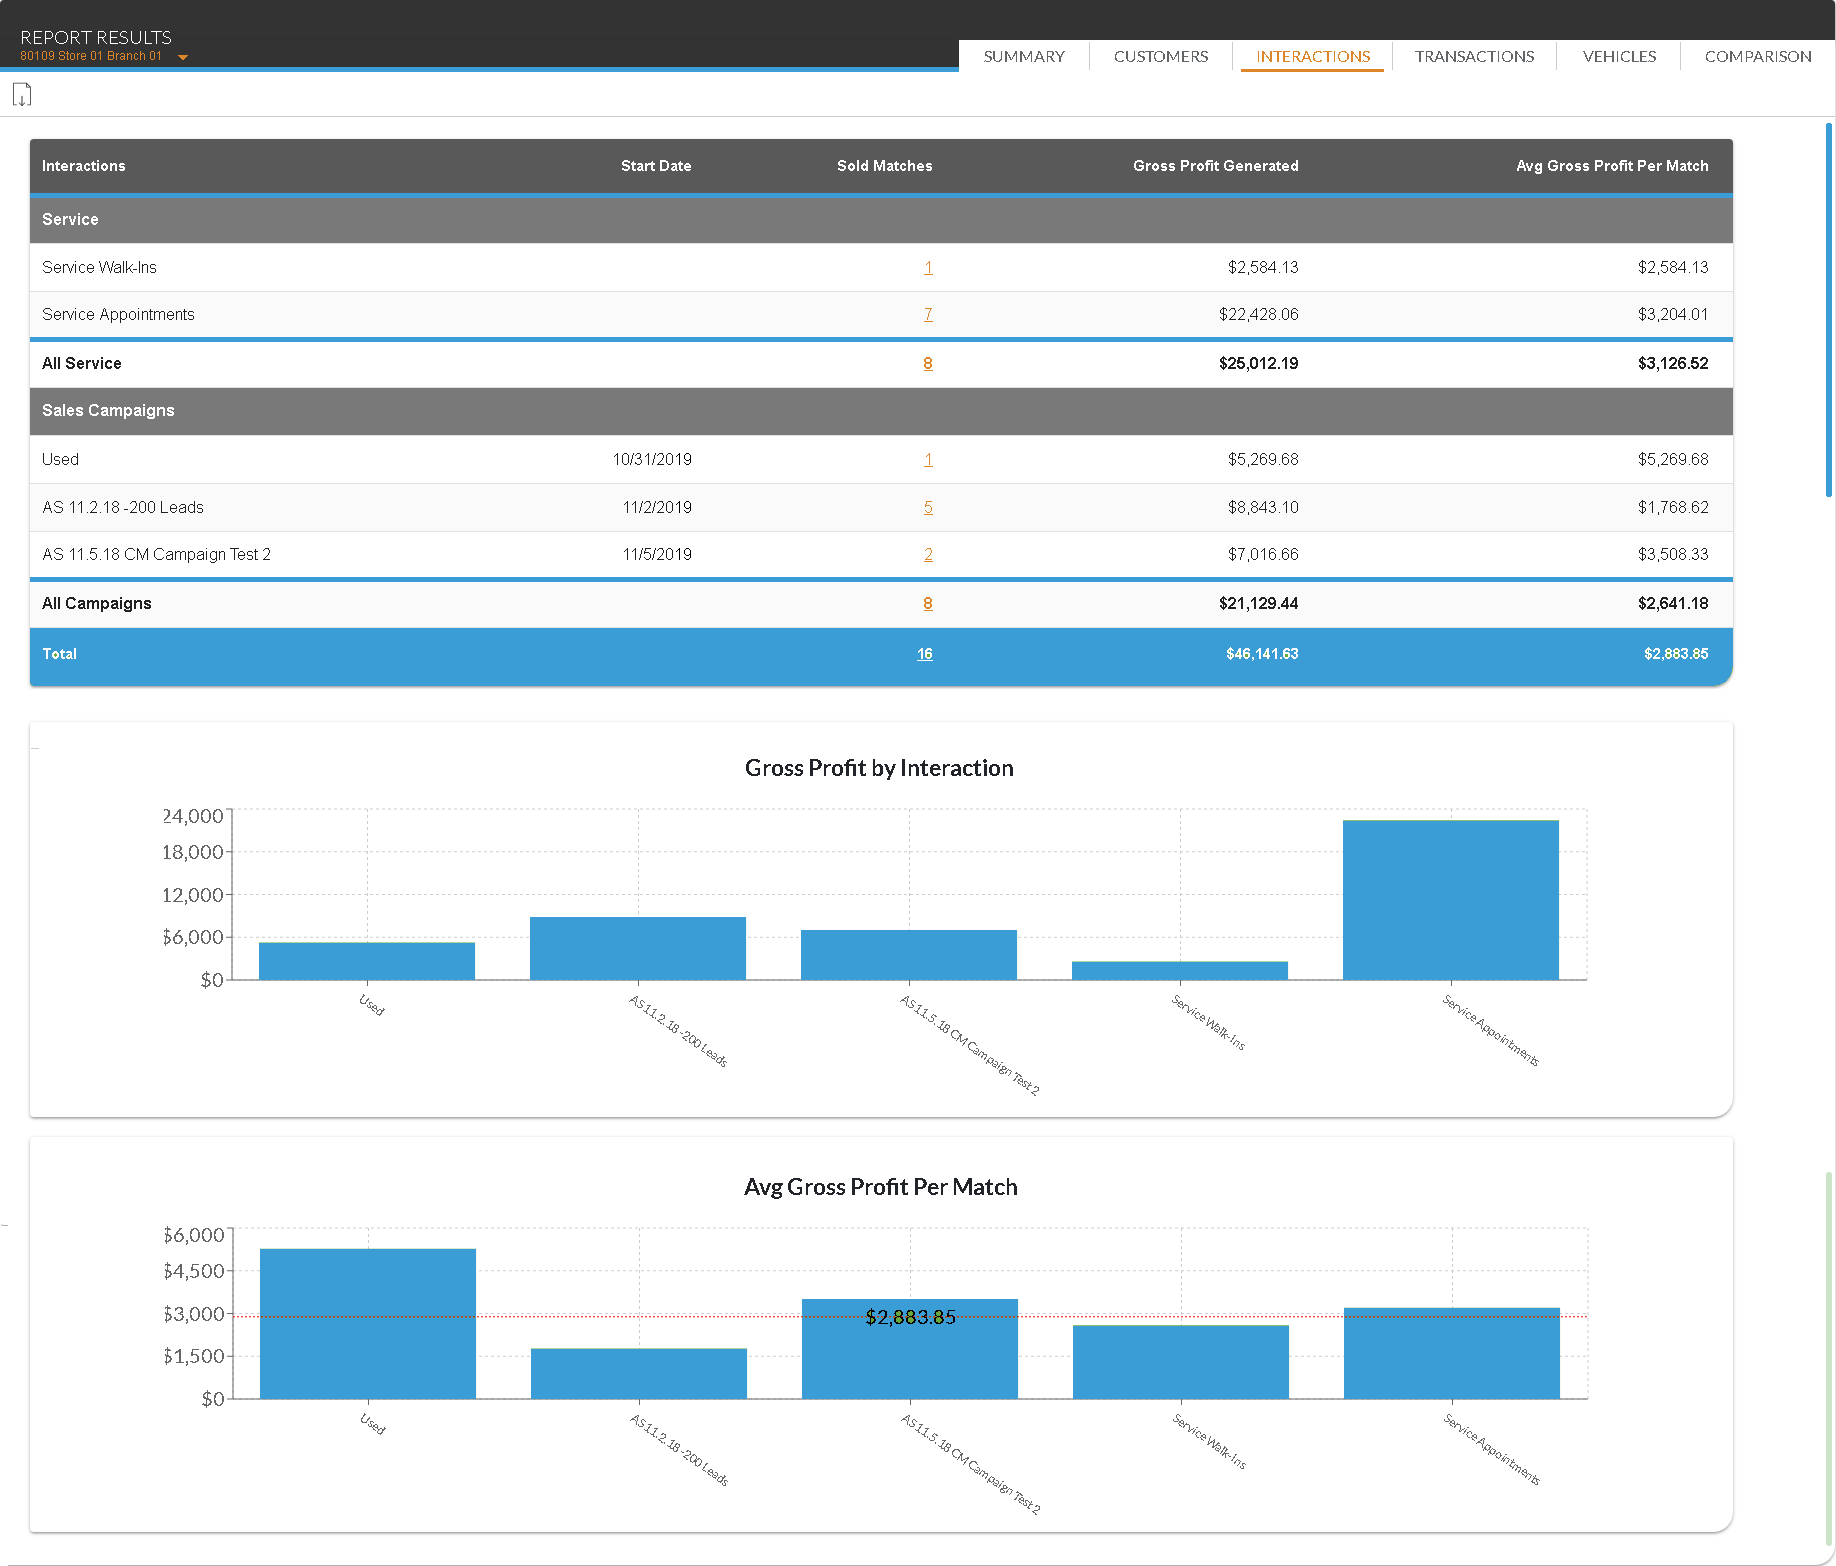
The graphs on this screen display gross profit or revenue information based on the entry in the Displayed Results field in the Report Criteria section.
The Gross Profit/Revenue by Interaction graph displays a chart of the percentage of gross profit or revenue generated by each interaction, such as service appointments or sales campaigns. The Avg Gross Profit/Revenue Per Match graph displays a chart of each interaction's gross profit or revenue and the average profit or revenue.
The following columns are available on the Interactions tab.
Interactions: The name of the interaction displays. Interactions are divided into sales campaigns and service interactions.
Start Date: The date on which the sales campaign began displays.
Sold Matches: (Link) The number of vehicles sold to XtreamService prospects displays as a link. Click the link to display the Detailed Results window, where details of the transactions can be reviewed.
The following fields only display if Gross Profit is selected in the Displayed Results field in the Report Criteria section at the top of this screen.
Gross Profit Generated: The gross profit generated by vehicles sold to XtreamService prospects displays.
Avg Gross Profit Per Match: The average gross profit generated per vehicle sold to XtreamService prospects displays.
The following fields only display if Revenue is selected in the Displayed Results field in the Report Criteria section at the top of this screen.
Revenue Generated: The total revenue generated by vehicles sold to XtreamService prospects displays.
Avg Revenue Per Match: The average revenue generated per vehicle sold to XtreamService prospects displays.
The following fields display when Lead Date is selected in the Type field in the Report Criteria section.
Total Delivered: In the Service section, this column displays the total number of interactions of the corresponding type. In the Sales Campaigns section, this column displays the total number of leads sent to the Customer application in the Digital Retail Platform for the corresponding sales campaign.
Closing Rate: The percentage of interactions that resulted in vehicle sales displays.
Click here for a list of products that may be mentioned in this help file.